
Although Bitcoin (BTC) is still trading in a largely sideways trend, indicators suggest that the flagship decentralized finance (DeFi) asset has just got out of a lengthy bear market and has embarked on a bullish journey that might see it massively growing its price.
In fact, Bitcoin’s 200-week moving average (200WMA) suggests that the recent bear market was the worst in history for the maiden cryptocurrency, as observed in a chart pattern analysis by the crypto market expert PlanB also known as 100trillionUSD, and shared on July 12.

At the same time, Bitcoin’s relative strength indicator (RSI) has emerged from the zero line on the two-week chart, indicating the start of a bull market, as it imitated the trend from 2016, according to a tweet shared by pseudonymous crypto analyst Trader Tardigrade.
On top of that, trends indicate that Bitcoin is preparing for a possible all-time high (ATH), as it has historically demonstrated the start of a bull run in the 22 months before the United States presidential election and has recently entered the pre-run phase, the crypto trading expert explained.
Bitcoin price analysis
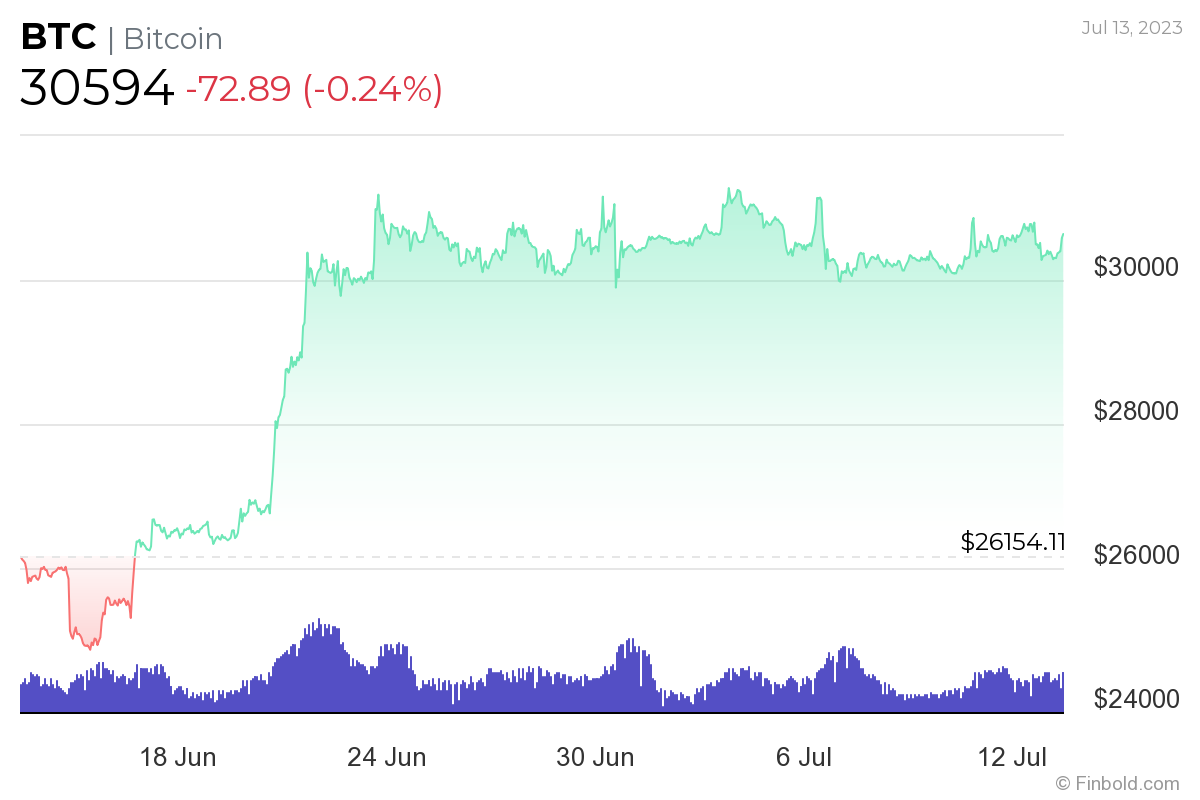
Meanwhile, Bitcoin was at press time trading at the price of $30,594, indicating a loss of 0.24% in the last 24 hours and declining 1.77% across the previous seven days while still hanging onto the 16.98% gain from its monthly chart.
Notably, in addition to the above trends, Bitcoin’s recovery and a potential new ATH could factor in the US Securities and Exchange Commission (SEC) possibly approving the first-ever spot Bitcoin exchange-traded fund (ETF) amid a surge of applications and re-applications pioneered by the world’s largest asset manager BlackRock (NYSE: BLK).